

Developed by Microsoft, Microsoft Excel is a spreadsheet application, which is generally included in the Office package along with other word processing tools. Excel comprises of graphical interfaces, various calculation features, macro programming, etc.
Microsoft Excel is used for generating spreadsheets calculation data on the fly. It can purely be used for data compilation in a table, creating graphs or for compiling financial reports. The basic tools contained in Microsoft Excel sheet include, home, page layouts, insert, data, view, formulas and review.
Working with these data formulas and functions is a step by step process as mentioned below:
Step 1: To get starts, go to the “Start Menu”.
Step 2: Type in “Microsoft Excel” in the “search programs and files” space and double click on the Word option. (Check the Screenshot Below)

Step 3: Click on the chart type, followed by chart subtype which you want to use on your spreadsheet. To check the available chart types, simply click on the “Insert Chart” dialogue box and scroll through the available chart type options on the spreadsheet with the help of arrows. (Check the Screenshot Below)
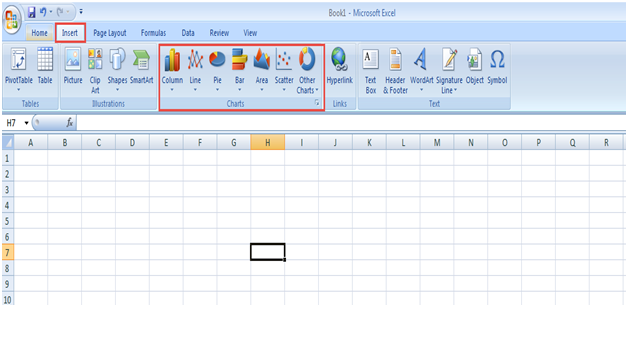
Step 4: Next, click on the “Insert” tab in Microsoft Excel menu bar.
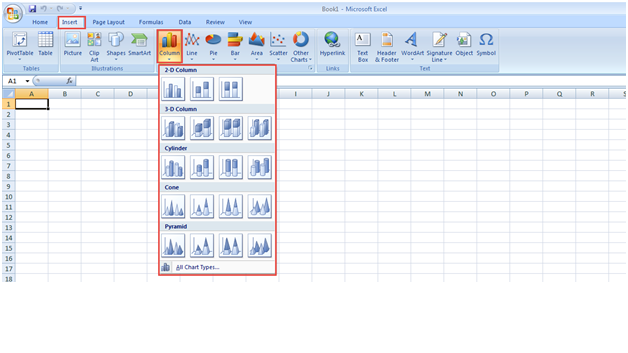
Step 5: Click on the “columns” option to add the different columns to your spreadsheet. You can add 2D and 3D columns to your sheet as required. (Check the Screenshot Below)
Step 6: Again click on the “Insert” tab on the Excel menu bar.
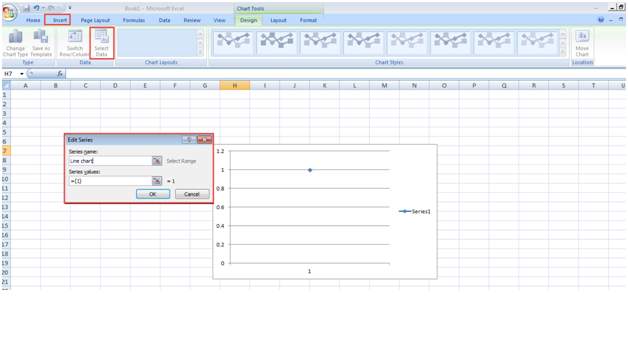
Step 7: Click on the “Line” option for adding different line chart to your spreadsheet. Here you can select the data in order to enter the values.
Step 8: A small dialogue box will appear on your screen. Here, you are required to enter the desired values.
Step 9: Click “OK” to save the changes. (Check the Screenshot Below)
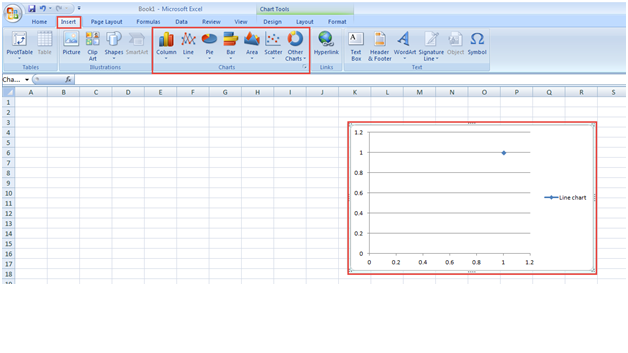
Step 10: As shown below, we can add any type of chart as required. For instance, we can add the bar graph to display the figures of our document, scatter diagrams, area etc.
Step 11: User can also change the setting and design of the chart figures. (Check the Screenshot Below)