


For in-depth analysis of numeric data or to answer unanticipated questions about your worksheet data, it is important that learn how to create a Pivot Table report or a Chart report in MS Excel.
What Use a Pivot Table and Chart Report?
Pivot Table report is an interactive way to quickly summarize, explore, analyze and present summary data. A Chart report, on the other hand, can help you visualize the summary data of Pivot Table report such that you can easily point out the comparisons, trends and patterns. Both the Pivot Table and Chart reports enable you to make informed decisions regarding any critical data in your organization.
Follow the steps mentioned below to learn how to use pivot table and charts in Microsoft Excel:
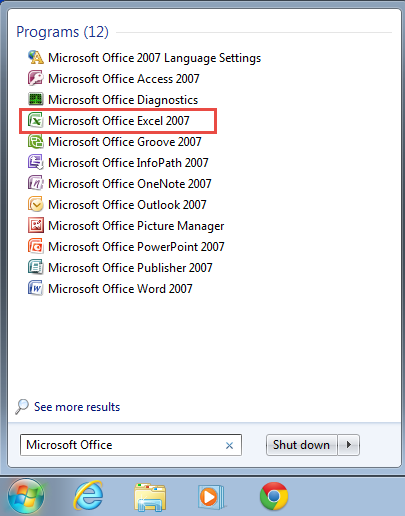
Step 1: To get started, go to the “Start Menu”.
Step 2: Type in “Microsoft Excel” in the “Search Programs and Files” space and select Microsoft Office Excel to open the program. (Check the Screenshot Below)
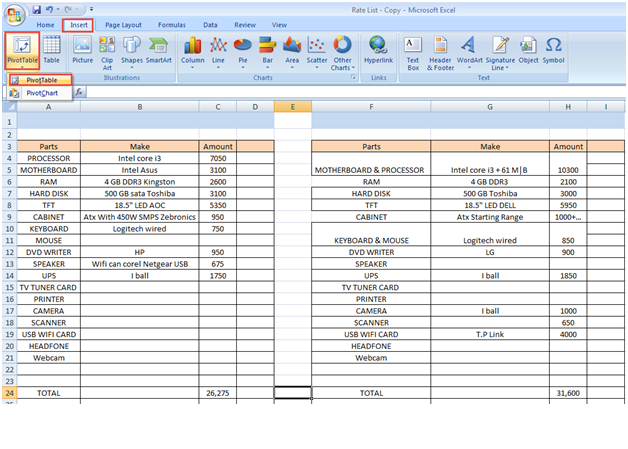
Step 3: Click on the “Insert” option on the Microsoft Excel menu bar.
Step 4: Next, go to the “Pivot Table” option. (Check the Screenshot Below)
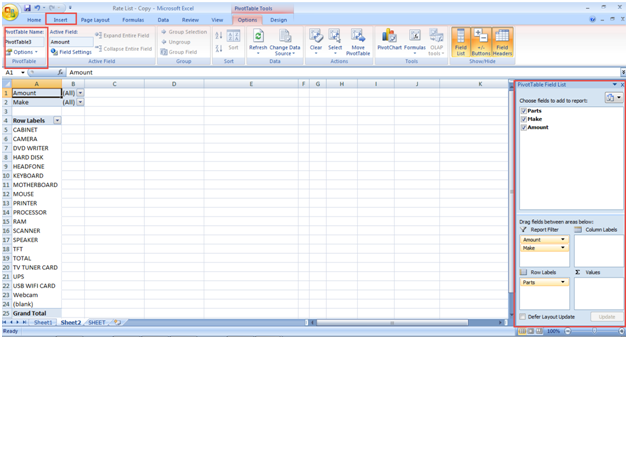
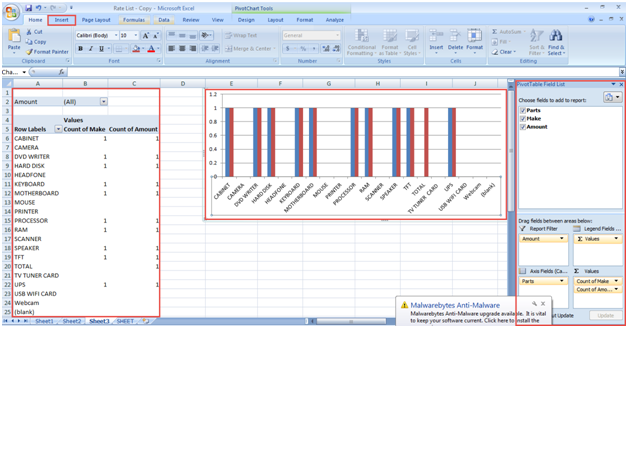
Step 5: Select the sheet and click on the “Pivot Table” option. The panel to the right of the sheet allows you to adjust the parts, amount, and marks on the sheet. Make various adjustments according to your requirements. (Check the Screenshot Below)
Step 6: In order to create the pivot chart, you first need to select the sheet and then click on the “Pivot Chat” option.
Step 7: Select the pivot table and sub type pivot chart. A dialogue box will appear on your screen. (Check the Screenshot Below)
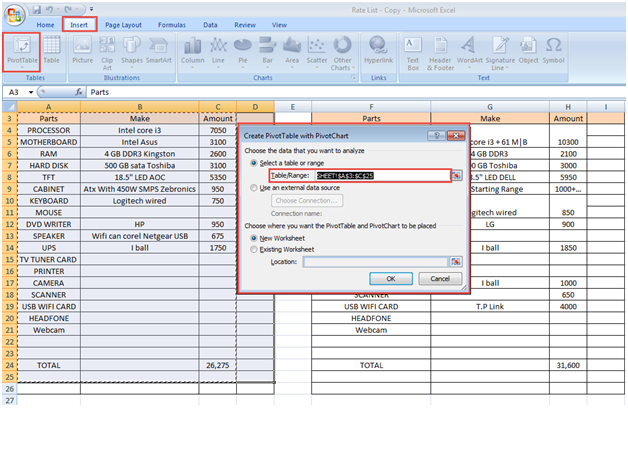
Step 8: Here, you can also add the pivot charts to your sheets. This allows you to filter your items easily. (Check the Screenshot Below)
Congratulations! You’ve successfully used private table and chart in MS Excel.
You can try copying sample data from the Internet onto an Excel sheet for more practice. Please let us know if you need help in case you were unable to fully understand the above tutorial on using pivot table and charts in MS Excel.